Chapter 1: It’s About Results
I. What makes a Good Plan
a. The value of a plan is the decisions it influences.
b. Plans should be measured by results.
1. Is the plan simple? Is it easy to understand and execute? Can you explain it
simply?
2. Is the plan specific? Are the goals concrete and measurable? Does it have specific
actions with specific dates of completion, specifically responsible people with
specific budgets?
3. Is the plan realistic? Can you realize these goals within the budget that you’ve
created and within the time frame?
4. Is the plan complete? Does it include all the necessary elements?
• All business plans are different
• There is no guarantee that the plan will work.
• If the plan doesn’t follow all of the required steps, then it most likely will not
work.
II. Use of Business Plans
a. To logically look at all of the important aspects of a business.
b. Define goals and to achieve them.
c. Create regular business reviews.
d. Support a grant proposal.
e. Define agreements between parties.
f. Set a value on a business for sale or for legal purposes
g. Evaluate a new product, promotion, expansion, or service.
III. Keys to Better Business Plans
a. Use the business plans to set goals, responsibilities, and deadlines.
b. Assigns tasks to people or to departments and sets milestones and deadlines for
tracking executing strategies.
c. For every strategy, there needs to be 10 actions.
d. There must be meeting time in place for regular review and possible course
corrections.
e. The plan must be practical.
IV. Business Plan Don’ts
a. Don’t use the plant to show how much you know about your business.
b. A business plan should not be more than 50 pages long….
V. No Time for a Business Plan
a. This is a misconception. The busier you are. The more you need a plan…
b. You don’t want to run your business reactively.
VI. Summary
a. The business plan does not sell ideas.
b. Investors invest in people and ideas.
c. The business plan is a way to present information about how your business works.
Chapter 2: Pick Your Plan
I. What is a Business Plan?
a. A plan that allows a business to look ahead, provide resources, prepare for problems,
and/or opportunities.
b. Businesses need plans to improve their odds of growth and development by placing
priority on those actions, products, etc that are most important.
II. What is a Start-Up Plan?
a. This includes a summary;
b. A mission statement;
c. Keys to success;
d. Market analysis;
e. Finally a break-even analysis.
•http://www.miniplan.com
III. Is There a Standard Business Plan?
a. Formats and outlines vary, but there are generally common components.
i. If you’re developing the plan for internal use only, there’s no need for background
details.
b. Company description, product description, or service description.
c. Market.
d. Forecasts.
e. Management Team.
i. Very important for investors.
f. Financial Analysis.
i. A financial history is most important for banks.
IV. What is Most Important in a Plan?
a. Usually Cash Flow Analysis & Specific Implementation Details.
b. Why cash flow?
i. It is important and hard to follow for a company.
ii. Cash is not profit.
iii. Profits don’t guarantee substantial cash in the bank.
iv. Many profitable companies fail because of lack of cash-on-hand.
c. Implementation (action) describes how and what makes things happen.
i. Strategies mean nothing unless you assign jobs with dates, budgets, follow-up actions,
and result tracking.
ii. The business plan is about succeeding and improving.
V. Can You Suggest a Standard Outline?
a. Executive Summary: (To be written last) just a page or two of highlights of the company.
b. Company Description: Legal establishment, history, start-up plans, etc.
c. Product or Service: Describe what you’re selling. Focus on customer benefits.
d. Market Analysis: You must know your market, customer needs, where they (customers)
are, how to reach them, etc.
e. Strategy and Implementation: Be very specific. Include management responsibilities with
dates and budgets. Make sure you track the results.
f. Management Team: Describe the organization and the key management team members.
g. Financial Analysis: Make sure to include at least projected Profit and Loss and Cash Flow
tables.
VI. Standard Tables and Charts
a. Cash Flow Chart.
i. The single most important numerical analysis in a plan.
ii. Should have a Sales Forecast and Profit and Loss statements.
iii. Should have Personnel listings, projected Balance Sheet, projected Business Ratios,
and Market Analysis tables.
iv. Should be a bar chart and pie charts to illustrate the numbers.
Outline order and sequence in a standard business plan
1.0 Executive summary.
1.1 Objectives
1.2 Mission
1.3 Keys to Success
2.0 Company Summary
2.1 Company Ownership
2.2 Company History (for ongoing companies) or Start-up Plan for new companies.
2.3 Company Locations and Facilities.
3.0 Products (or services, or both)
3.1 Product (or service, or both) Description
3.2 Competitive Comparison
3.3 Sales Literature
3.4 Sourcing
3.5 Technology
3.6 Future Products
4.0 Market Analysis Summary
4.1 Market Segmentation
4.2 Target Market Segment Strategy
4.2.1 Market Needs
4.2.2 Market Trends
4.2.3 Market Growth
4.3. Industry Analysis
4.3.1 Industry Participants
4.3.2 Distribution Patterns
4.3.3 Factors of Competition
4.3.4 Main Competitors
5.0 Strategy and Implementation Summary
5.1 Strategy Pyramid
5.2 Value Proposition
5.3 Competitive Edge
5.4 Marketing Strategy
5.4.1 Positioning Statement
5.4.2 Pricing Strategy
5.4.3 Promotion Strategy
5.4.4 Marketing Programs
5.5 Sales Strategy
5.5.1 Sales Forecast
5.5.2 Sales Program
5.6 Milestones
6.0 Management Summary
6.1 Organizational Structure
6.2 Management Team
6.3 Management Team Gaps
6.4 Personnel Plan
7.0 Financial Plan
7.1 Important Assumptions
7.2 Key Financial Indicators
7.3 Break-Even Analysis
7.4 Projected Profit and Loss
7.5 Projected Cash Flow
7.6 Projected Balance Sheet
7.7 Business Ratios
7.8 Long-term Plan
V. Form Follows Function
a. If the business plan is for internal use, focuses on well-known existing products or services, then there may be no need for product details.
b. Business plans looking for investors (grantors) need to have some convincing market data.
c. A small business plan used by a small group of people close to the company may not need much market research.
i. If there is a chance to improve the company and the plan by learning about the market.
ii. If there isn’t, then this step may not be required.
VII. Investor Summaries and Loan Applications (Grant Applications)
a. When used to back up a loan application, potential investors may want a summary document as well as a complete plan.
b. Many investors like to see a brief summary, and the loan application doesn’t always require a complete plan.
c. If done properly, you can use the summary paragraphs in the main sections---company, market, product, etc.---to create these specific summary documents.
VIII. Timeframes: Is 3 Years Enough?
a. A business plan should project monthly sales for the next 12 months and annual
sales for the following two years (24 months).
b. This means that unless the business doesn’t pay off by the third year, then it may not make sense to plan beyond three years.
c. Plan for your business to last well into the future. Just don’t include those plans in
the detailed portions of the business plan.
IX. Summary
a. There are many kinds of business plan software packages, such as Business Plan
Pro™, but ultimately this plan is yours.
b. Make sure that the plan best suits your needs.
Chapter 3: The Mini-Plan
I. Objectives
a. These are business goals.
b. Set market share objectives, sales objectives, and profit objectives.
c. Companies need to set objectives (goals) and plan to achieve them.
d. Be specific.
i. Mention achieving a given level of sales or profits;
ii. A percentage of gross margin, a growth rate, or a market share
e. Don’t use generalities.
i. ‘Being the best’;
ii. ‘Growing rapidly.
f. Why?
i. ‘Being the best’ or ‘Maximize customer satisfaction,’ cannot be measured.
ii. Better goals would be holding gross margin to 25% as a minimum, selling more than
$3million, or achieving 6% profit on sales and/or 10% return on equity.
g. What if my objectives (goals) are less tangible?
i. Find a way to measure them
ii. If image and awareness are important ways to measure growth and improvement,
then find a statistically valid survey instrument to measure the company’s image
and awareness.
iii. It is possible to set market share goals and purchase research to measure the actual
share.
iv. You could focus on customer satisfaction.
1. Use or at least plan to use a survey to measure customer satisfaction or define
numerical goals regarding returns or complaints.
II. Mission Statement
• This defines the business concept.
• It should define underlying goals (like making a profit) in broad strategic terms,
including what benefits are offered.
a. What Business You Are In
i. Don’t narrow yourself by definition.
1. For example the railroad industry lost the chance to expand itself by disdaining
itself. They thought they were in the business of running trains on tracks rather
than transporting goods and services
2. When trucks and buses grew and highways, the railroads were left behind.
b. Customer Satisfaction
i. Experts have found that the mission statement is the place where the source of
customer satisfaction is most likely to be found.
ii. References to customer satisfaction should be included here.
c. Workplace Philosophy
i. Some mission statements define internal goals
1. Creative working environment.
2. Respect for diversity.
ii. Experts also look to the mission statement to find statements about the workplace
philosophy.
d. Value-Based Marketing
i. This, the experts state, help companies better understand themselves. (Remember
the railroad industry example?)
ii. You make a business value proposition (idea statement).
1. What benefit does the business offer, to whom and at what relative price:
2. Automobile manufacturer proposes that it offers safe, reliable cars for a
relatively inexpensive price.
3. A fast-food restaurant offers quick and consistent lunches at a low price.
II. Keys to Success
a. If one is in the retail business, then one might say the keys to success would be these
things. These are also referred to as business priorities
i. Location, convenient parking, and low prices.
b. A computer store might look different
i. Knowledgeable staff, major brands, and good advertising.
c. Berry calls the ability to identify these keys to success as, ‘a law of inverse focus.’
i. He has found that companies that have more than 4 of these keys are less likely to
meet these priorities.
ii. He refers to this as a great way to focus on those actions that make the business
work.
III. Break-even Analysis
a. This is based on three assumptions:
i. Average per-unit sales price (also known as per-unit revenue)
1. Should take special offers and sales discounts.
2. For non-unit based businesses, make the per-unit revenue $1 and your costs
as a percent of a dollar.
Illustration 3-1: Break-even Analysis

Source:
www.bplans.com/common/gifs/QA/bplans/Hurdle-Illus2-1.gif
ii. Average per-unit cost
1. By using a Units-Based Sales Forecast table (for manufacturing and mixed
business types), this enables one to project unit costs (amount it costs to make a
sale).
2. For a retail business, use a percentage estimate.
• If a retail store runs on a 50% margin, then the per-unit cost would be .5 and
per-unit revenue of .1.
Illustration 3-2: Break-even Chart

Source: http://www.bplans.com/common/gifs/QA/bplans/ILL2-2-BreakEvenChart_small.gif
iii. Monthly fixed costs
1. This defines fixed costs as those that would continue even if you went broke.
2. The best thing to do would be use regular fixed costs, including payroll and
normal expenses.
NOTE: According to chart 3-2, as sales increase, the profit line passes though the zero line, also known as the bread-even line or break-even point. This company has to sell 1,222 units in order to break the zero planes to break-even.
IV. A Reminder.
a. The break-even analysis depends on 3 key assumptions.
i. Average per-unit sales price (per-unit revenue)
1. See Sales Forecast Table.
ii. Average per-unit cost
1. This is the incremental cost, or variable cost, of each unit of sales. If you buy
goods for resale, this is what you paid, on average, for the goods you sell. If
you sell a service, this is what it costs you, per dollar of revenue or unit of
service delivered, to deliver that service. If you are using a Units-Based Sales
Forecast table (for manufacturing and mixed business types), you can project
unit costs from the Sales Forecast table. If you are using the basic Sales
Forecast table for retail, service and distribution businesses, use a percentage
estimate, e.g., a retail store running a 50% margin would have a per-unit cost
of .5, and a per-unit revenue of 1.
iii. Monthly fixed costs
1. Technically, a break-even analysis defines fixed costs as costs that would
continue even if you went broke. Instead, we recommend that you use your
regular running fixed costs, including payroll and normal expenses (total
monthly Operating Expenses). This will give you a better insight on financial
realities. If averaging and estimating is difficult, use your Profit and Loss
table to calculate a working fixed cost estimate—it will be a rough estimate,
but it will provide a useful input for a conservative Break-even Analysis.
Source:
http://articles.bplans.com/financing-a-business/break-even-analysis
NOTE: Microsoft Excel has a tutorial on Sales Forecasting. However this article by The Retail Owners’ Institute may help even more.
Sales Forecasting: Part Art, Part Science
If you are like many retailers, you probably haven’t put together a comprehensive business plan since you first went into business (if you did it then!). But a carefully thought-out plan is essential to the success of your retail business. Owners and managers who plan ahead invariably achieve more than those who don’t take the time to draw up forecasts and set realistic goals for their stores.
Undoubtedly, the most important forecast you will make is the sales forecast. It requires that you make strategic decisions regarding the future of your business based on accurate information of your past performance and thoughtful projections into the future. In short, planning a sales forecast is part art, part science.
Where to Begin
The process is not as bad as it sounds. Dig out your sales figures from the past three years (if you’ve been in business that long) and note your month-to-month sales trends. You may find it helpful to summarize sales figures on a chart or spreadsheet. This will give you basic forecasting data.
Past sales figures by themselves, however, don’t give all the information you need to write an intelligent sales forecast. You also must consider a multitude of other factors. Here are some important ones to keep in mind. Each of these has probably influenced your past sales, and will affect sales in the future.
* Your business’ previous sales levels.
* Comparisons of similar selling periods.
* Your customers’ lifestyles and tastes.
* The general condition of the local and national economy.
* Business conditions in your retail niche.
* Changes in the level of competition.
* Changes in store’s policy.
* Changes in your store’s size, space, or product mix.
* Dates of holidays, number of selling days.
* Changes in pricing policies.
* Changes in morale and motivation among your employees.
* Advertising and promotion campaigns.
* Changes in relationships with suppliers.
* External conditions that might have caused more potential customers to move into, or
out of, your trading area.
* Establishment of goals and planning.
Think about how each factor has influenced past sales. Then think about how to work these variables into your projections of future sales. Here are two examples of how to take these variables into account in your planning. Keep in mind that there is a mathematical equation for factoring each variable that is simple and logical to use. . .these provide the “science” of forecasting.
Factoring in the number of selling days
Suppose your total sales for last April were $40,000 in 25 selling days. Assume further that you’re planning for a 20 percent increase in sales month-to-month this year. If your number of selling days is going to drop to 23 days in April, what sales figure will give you a true 20 percent increase?
To factor in the decrease in selling days, multiply last April’s sales by the result of 23 divided by 25. That will give you the breakeven dollar amount for the upcoming year. Then multiply that figure by 1 plus the 20 percent increase you expect based on your historical data and the other factors above.
$40,000 x (23 ÷ 25) = $36,800
$36,800 x 1.20 = $44,160
Allowing for two fewer selling days, you need sales of $44,160 to achieve a true 20 percent increase this April over last April.
If the situation were reversed, and you had 25 selling days in this April, compared to 23 last year, simply reverse the fraction and multiply last year’s sales by the result of 25 divided by 23. Then, proceed as before: multiply that result by 1.20 to calculate the 20 percent increase you want. Result: With two more selling days, you’ll need $52,173 to make your true 20 percent increase.
Remember: To make your selling days conversion fraction, put the number of days in the previous year’s month on the bottom, and the number of days in your planning year’s month on top. If you reverse the fraction, your projections will come out either very low or very high.
Factoring in pricing policies
Another variable you can factor into your sales projections is rising (or falling) prices. For example, how should you change your sales plan if you expect rising prices to increase the amount of your average sales by five percent?
In this case, you start by multiplying last April’s $40,000 sales figure by 1.05 to find the amount that will keep you even with last year’s sales.
$40,000 x 1.05 = $42,000
So, on the basis of rising prices alone, you can plan for a $2,000 increase, assuming your unit sales remain constant. Of course, that $2,000 doesn’t represent a true increase, since your own rising costs offset it. It does, however, give you the new base from which to make your other calculations. Once you’ve figured the new base amount, you can calculate the effect of other factors, such as changes in the number of selling days, then multiply by 1.20 to arrive at a true 20 percent increase.
You’ll have to devote some time to calculating how these variables will affect your sales. As you can see from the two examples we’ve worked here, making straight month-to-month comparisons can be very misleading. Without accounting for an increase in selling days, you could easily conclude that you are achieving good sales increases when your sales are actually dropping.
The Final Steps
The next step in the sales forecasting process is where it becomes an “art.” Look at your projections and see if they make sense. Do they pass the “plausibility test”? Based on all the information available, can you substantiate the dollar figures you planned for sales? Are they sound enough to use in planning other parts of your business? Are they good enough for your banker?
Finally, compare your forecasts to actual sales results as you see them develop. Don’t worry about occasional minor variations. But if you consistently over- or under-estimate your sales by 10 percent or more, you should find out what’s causing the discrepancy. Then you can make whatever adjustments you think are appropriate. Make sure that when you have completed this process that it all makes sense and feels right. . .are your forecasts logical and complete?
Your sales forecasts are the backbone of your business plan. Once you are satisfied your forecasts and the plan make sense on all counts, create a couple of alternate plans based on different assumptions. That way, if something changes your sales results significantly, you can immediately switch to an alternative plan.
You should have plans for how to react to a variety of future changes, either positive or negative. It is particularly critical to plan for a worst-case scenario to know some of your options ahead of time. Having contingency plans will enable you to follow your primary plan more confidently.
Sales forecasting involves both “science” and “art.” There are preexisting formulas to help you in factoring different variables in your forecast, giving you the freedom to make sound, sensible estimations and assumptions based on those formulas. Don’t let the process intimidate you; take advantage of it and get the best possible strategic planning for your business.
Forecasting Retail Sales
Minimize
Your sales forecasts are the backbone of your business plan. Good sales forecasting involves some "art" (that is, judgment) and some "science" (good old arithmetic!) The key: don't let the process intimidate you.
The crucial first step is simply getting something down on paper, what do you generally think sales will be each month for the next 12 months. Use the last couple of years as a guide. By all means, use round numbers; don't bog down in details!
Then, use your judgment. Think about all the factors that could influence your monthly sales, either up or down. Adjust your numbers as you see fit. Just be sure to make notes about your assumptions for later reference.
©Copyright 2009. The Retail Owners Institute®. All rights reserved.
Source:
http://www.retailowner.com/ROIarticles/A1all/tabid/202/Default.aspx
V. Market Analysis
a. Major research is not necessary to accomplish this.
i. You may wish to do so later on. (See Chapter 9: Know Your Market).
ii. The goal is to make a good ‘educated’ guess about how many potential customers
you might have.
iii. A quick break-even analysis ties one’s initial business numbers to the number of
sales one needs to make.
iv. Now, let’s look at how many potential customers one will have in order to think
about how important it is to break even.
v. Lets look at a mythical company that Tim Berry uses from the text.
Potential Customers Growth Total Cust’s
Consumer 2% 12,000
Small Business 5% 15,000
Large Business 8% 33,000
Government -2% 36,000
Education 0% 19,000
Total 2.78% 115,000
vi. NOTE: 2.78% is the average of the above growth numbers, while
the total number of customers is simply the sum of the above
numbers. This analysis table allows you to illustrate the estimated
total customer base and your projected rate for each group.
vii. This acts as a ‘reality check’. Once we have the break-even
analysis, we now need to know how many customers we may
have, so we can begin to think about the importance of breaking
even.
ix. The marketing analysis table on the previous page gives a simple
list of market segments. Each segment refers to a group of
customers. The goal is to define each of the groups according to
what needs you supply, demographic characteristics, buying
habits, preferences, etc. In the marketing analysis table on the
previous page, the total potential customers estimated and the
annual growth rate expected for each segment were included.
These numbers you would have to do on your own.
x . Now let’s look at a mythical company called AMT Computer
Company. This comes from http://articles.mplans.com/market-
forecasting-should-be-part-of-your-plan/. The article is entitled, Create a Market
Forecast for your Marketing Plan.
xi. According to Berry, A market forecast is a core component of a
market analysis. It projects the future numbers, characteristics, and
trends in your target market. A standard analysis shows the
projected number of potential customers divided into segments.
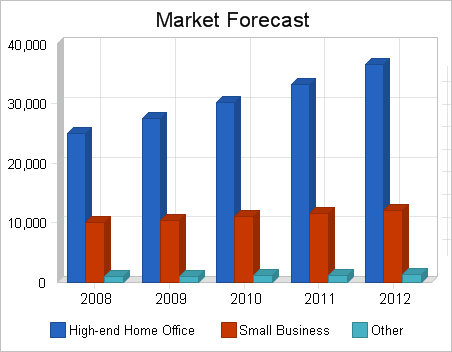
xii. Market Forecast - Example The AMT computer store has a simple market forecast. The plan defines two target market segments, and the forecast projects how
many potential customers in each of those segments by years, for
five years. In the market forecast, the numbers indicate that there are 25,000
home offices included in the market, and that number is growing at
an estimated five percent per year. There are also 10,000 small
businesses in the area, and that number is also growing at five
percent per year.These numbers are estimates. Nobody really knows, but we all
make educated guesses. AMT’s owners researched the market as
well as they could, then estimated populations of target users in
their area and the annual growth rates for each. The chart below offers a visual
representation of the AMT Computer Company market forecast.

http://i211.photobucket.com/albums/bb88/paloaltosoftware/marketanalysisbar.png
This is a histogram of what the mythical company known as AMT Computer would look like if we were to perform a Market Forecast.
The table below shows the market forecast described for AMT.
Potential Customers Growth 2008 2009 2010 2011 2012 CAGR
High-End Home Office 10% 25,000 27,500 30,250 33,275 36,603 10.00%
Small Business 5% 10,000 10,500 11,025 11,576 12,155 5.00%
Other 6% 1,000 1,060 1,124 1,191 1,262 5.99%
Total 8.57% 36,000 39,060 42,399 46,042 50,020 8.57%
Market Value
Normally you would also look at market value, not just market size. For example, even though AMT’s high-end home segment is 2.5 times larger than its small business segment as measured by number of customers, the small business customer spends almost four times as much as the home office customer. Therefore the small business market is a more important market in terms of dollar value. The table below shows AMT’s method for tracking market value.
Market Segment Avg $ Market Product Loyalty Buyer
per cust. Value Attitude Status Readiness
High-end Home $3,200 $98 Million Positive Medium Medium
Office
Small Business $12,500 $138 Million Indifferent None Defensive
Other $4,800 $5 Million Depends Strong Informed
The important numbers in this table are the average purchase per customer and the market value:
Average purchase per customer is an educated guess based on AMT’s experience. Sales managers got together to make the estimate. Although AMT would have liked some external source of information to use for this, there was none available. Notice that the home office customer tends to purchase much less overall than the small business customer.
The market value is simple mathematics. Multiply the number of potential customers in the market by the average purchase per customer. In this case they took the average number of customers in each segment over the five-year forecast period and multiplied that by the average purchase per customer, to calculate the market value.
The other items in this market analysis table are subjective qualities that help with marketing. AMT assigns these points to people charged with preparing marketing materials.
Reality Checks
A market forecast should always be subject to a reality check. When you think you have a forecast, you need to find a way to check it for reality. In AMT’s case, if the total market is worth some estimate they could estimate sales of all the competitors and see if the two numbers relate to each other. In an international market, you might check production and import and export figures to see whether your estimates for annual shipments appear to be in the same general range as published figures. You might check with vendors who sold products to this market in some given year to see whether their results check with your forecast. You might look for macroeconomic data to confirm the relative size of this market compared to other markets with similar characteristics.
Review Target Focus
The market analysis should lead to developing strategic market focus. That means selecting the key target markets. This is the critical foundation of strategy. We talk about it as segmentation and positioning.
Under normal circumstances, no company will attempt to address all the segments in a market. As you select target segments, think about the inherent market differences, keys to success, competitive advantage, and strengths and weaknesses of your company. You want to focus on the best market, but the best one is not necessarily the largest one or the one with the highest growth. It might be the one that matches your own company profile.
Source: http://articles.mplans.com/market-forecasting-should-be-part-of-your-plan/
VI. Pause for Reflection
a. These are a list of questions that you should be prepared to answer
i. How does your business look from this viewpoint?
ii. Does it make sense?
iii. Can you make the sales needed to break even?
iv. Is the market big enough?
v. Are your projections realistic?
vi. Can you bring together the keys for success?
VII. Summary
a. If you are confident that you can make your break-even numbers work, and you are
confident that you have the number of customers necessary to accomplish it, then it is
time to develop the plan.
b. If not, then perhaps it’s best to do more research and to revise the idea, possibly even
abandon the idea and to try something else.


No comments:
Post a Comment